The Google Ads reporting suite in Google Analytics is essential for advertisers looking to drive profitable sales. I’ll explain the setup and analysis process in this post.

Before you can view Google Ads reports in Google Analytics, complete a couple of steps.
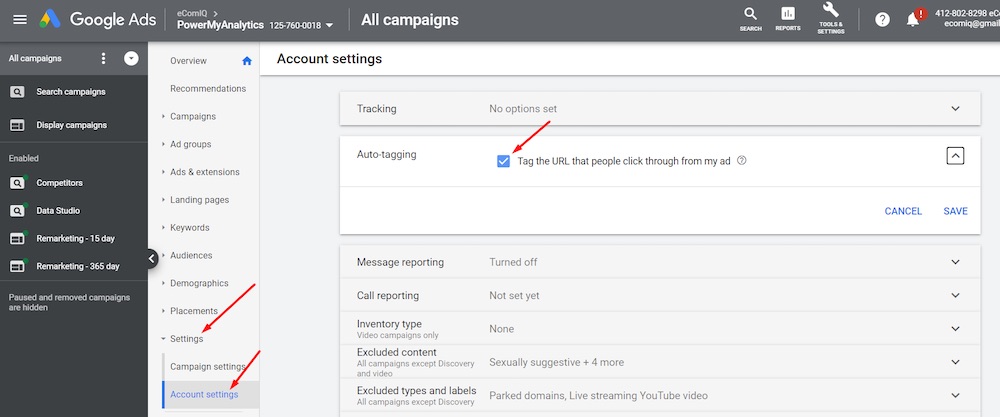
First, ensure you have auto-tagging enabled in the Google Ads platform at Settings > Account Settings. Auto-tagging will apply a query parameter to the end of all destination URLs so that Google Analytics can track those clicks.
Ensure you have auto-tagging enabled in Google Ads at Settings > Account Settings.
Then go to Google Analytics at Admin > Property > Google Ads Linking. Click “New Link Group” and select the Google Ads account to link to. You must have admin access to Google Ads and Google Analytics to complete the linking. For more, see at the Google Ads Help portal.
In Google Analytics, select the Google Ads account to link to at Admin > Property > Google Ads Linking.
Once you’ve completed the integration, the data will populate in Google Analytics at Acquisition > Google Ads.
The Google Ads data will populate in Google Analytics at Acquisition > Google Ads.
Auditing
Next, ensure you have reliable data from Ads in Google Analytics. Compare “Sessions” to “Clicks” in the Campaigns report, as shown below.
To ensure you have reliable data from Ads in Google Analytics, compare “Sessions” to “Clicks” in the Campaigns report.
The Campaigns report typically shows a bit more Clicks than Sessions, but I’ve seen the opposite, too. What you do not want is one being a lot higher than the other, such as in the screenshot above, where the number of Clicks is roughly double the number of Sessions for all campaigns. And an additional campaign named “(not set)” is reporting Sessions but no Clicks.
To diagnose the error:
- Ensure the destination URLs in Google Ads are correct and not causing redirects that strip out auto-tagging.
- Ensure all pages of your website contain Google Analytics tags, especially pages linked from Google Ads.
Driving Sales
Having spend and conversion data side-by-side in Google Analytics enables data-driven decisions. The “Clicks” sub-tab reports ROAS (Return On Ad Spend) by Campaign.
The “Clicks” sub-tab reports ROAS (Return On Ad Spend) by Campaign at Acquisition > Google Ads > Campaigns.
Applying a secondary dimension of “Search Query” will reveal the search terms of visitors who clicked your ads.
Apply a secondary dimension of “Search Query” to reveal the search terms of visitors who clicked your ads.
Analyzing these search terms can identify opportunities, such as:
- Add irrelevant search queries as negative keywords in Google Ads.
- Consider increasing bids on all keywords that drive profitable sales.
- Reduce bids on unprofitable keywords.
The “Bid Adjustments” tab at Acquisition > Google Ads > Bid Adjustments helps identify bids by device. In the example below, Mobile has been set to bid -50% — 50 percent lower than average. But the ROAS is better on Mobile than Computers. Thus it may be time to re-adjust Mobile bidding. Monitor this report regularly, especially if you’ve improved your site’s mobile experience.
The “Bid Adjustments” tab at Acquisition > Google Ads > Bid Adjustments helps identify bids by device.
Quick Access
Browse through the other Google Ads reports in Google Analytics (Acquisition > Google Ads) for actionable insights, to optimize. Assemble a list of reports to monitor frequently. Create links to saved reports for quick access or take the extra step of building the reports in Data Studio.
